An Introduction to Carbon Markets
This report was written by the team at Cypher Climate Brokers Limited. It does not seek to achieve any form of academic standard but hopes to educate clients, employees and website visitors of CCB.
For a PDF version of this file, please view below:
Download “An Introduction to Carbon Markets” (PDF, 2.2 MB)
Summary
This report seeks to provide an overview of the carbon market, how it has evolved, and where the market currently is in terms of legislation and market activity. After initially discussing the markets background, the report will then go on to analyse both the woodland and peatland (and briefly soil) carbon codes to understand sequestration rates, verification processes, price and key participants. Following this, the report will examine why the demand for carbon credits/offsets is expected to rise so dramatically in the UK and how the market must shift and adapt to prepare and handle this demand. Through Strutt and Parker, some key advice to landowners will then be laid out discussing the best ways to navigate this young, unpredictable marketplace. The report will then highlight the market activity over the last few years and the potential dangers/risks that voluntary carbon markets pose to net zero targets. Finally, it will provide a global insight, drawing what I hope to be an informative and useful market report to a close.
Background
Global
Since the United Nations Protocol in 1997 international carbon credits have been available for purchase under the Clean Development Mechanism (CDM) and the Joint Implementation (JI) mechanism, allowing host countries to sell the credits from their emission reduction projects to other countries. These credits were used to count towards the purchasing countries’ emission reduction targets. By the early 2000s the main voluntary standards for carbon credits were Verified Carbon Standard (VCS)/Verra, Gold Standard, Climate Action Reserve (CAR) and American Carbon Registry (ACR).
Compliance schemes such as cap and trade schemes and carbon taxes are also increasing in prominence and can interact with carbon credits. Global crediting activity rose rapidly until 2012, crashed in 2013 (due to a drop in demand from the EU ETS following the exclusion of almost all Kyoto credits for compliance in phase 3) and has stabilised since the Paris Agreement in 2015.
UK
In 2011 the UK closed its ‘Quality Assurance Scheme’ (QAS), a government-led initiative that sought to provide consumers with a quality kitemark for carbon credits, due to limited uptake by carbon credit providers. The QAS mostly included credits from the CDM, and emissions trading schemes. Although it was open to independent carbon credits such as those from Gold Standard or VCS to participate, these independent standards did not apply.
The Woodland Carbon Code (WCC) was established in 2011 as the UK’s government backed standard for quantifying emissions reduction from woodland and forestry projects. Projects must demonstrate successful woodland establishment, with tree growth and sequestration rates assessed at year five, thereafter at a minimum of ten-year intervals.
The Peatland Code (PC) was established in 2018, designed specifically for peatland restoration projects. Credits can only be used to ‘offset’ UK based emissions.
Agricultural soil carbon credits are an area under active development with a number of initiatives operating in the market, but at present no standardised code is established.
UK Markets
Regulated market
The UK emissions trading scheme (ETS) is set by ‘cap-and-trade’ regulations. This scheme was introduced on 1st January 2021 after the UK withdrew from the EU ETS. Each company operating under this programme is issued a certain number of carbon credits each year (based on their size and the efficiency of their operations relative to industry benchmarks). The scheme is focused on companies operating in energy intensive sectors.
Voluntary market
Voluntary carbon markets (VCMs) are markets where carbon credits are purchased, usually by organisations, for voluntary use rather than to comply with legally binding emissions reduction obligations such as an emissions trading scheme or carbon tax. Credits can be bought from public international crediting mechanisms, international crediting mechanisms, and domestic crediting mechanisms.
The Greenhouse Gas Protocol defines three “scopes” of emissions for companies. Scope 1 emissions are direct greenhouse gas emissions occurring from sources owned or controlled by the company, such as from company boilers or vehicles. Scope 2 emissions are emissions arising from the generation of electricity that the company purchases. Scope 3 emissions capture all other indirect emissions that occur as a consequence of the activity of the company, such as the extraction of materials, transportation of purchased fuels, or use of sold products and services.
Carbon credits
A carbon credit is a token representing the avoidance or removal of greenhouse gas emissions, measured in tCO2e. One carbon credit enables a company (or the credit owner) to offset 1 tonne of CO2 emissions. Buyers use carbon credits to enhance their climate credentials and sellers use them to finance activities to reduce emissions.
Article 6 of the UNFCCC Paris Agreement includes guidance on what carbon credits can be used for:
Article 6.2 establishes a reporting and accounting framework that enables countries to voluntarily trade international “mitigation outcomes”. This allows buyers to claim the emissions reductions when accounting for their Nationally Determined Contribution (NDC), while the seller relinquishes the right to them. In this way, double counting between the two targets is avoided.
The different types of carbon credits
Carbon credits can come in several forms, broken into reduction/avoidance credits and removal credits.
- Reduction/avoidance. Examples of carbon credits that reduce/avoid emissions that would have been produced include: displacement of fossil fuel generated electricity with electricity from renewable sources; avoiding deforestation or preventing peatland degradation; and carbon capture and storage at industrial facilities.
- Removal. Examples of carbon credits removing carbon dioxide from the atmosphere include: biological removals, such as afforestation, soil carbon enhancement, peatland restoration; and engineered removals, such as direct air carbon capture and storage (DACCS).
Voluntary purchase of carbon credits
Carbon credit markets today are dominated by forestry and renewable energy projects, with biological removals increasing rapidly.
- Supply. Previously many carbon credits were focussed on renewable energy, but global carbon credits are increasingly comprised of projects that focus on biological removal. Forestry credits were 42% of the global total in the last 5 years.
- Demand. Most global demand for carbon credits comes from financial services, oil, gas & petrochemical and consumer goods organisations. Demand is driven by Net Zero targets or offering consumers the opportunity to ‘offset’ their purchases. There is also interest from public institutions and consumers in ‘offsetting’.
Defining greenhouse gas removal approaches
Removals can be engineered or biological. Nature-based solutions are biological removals which are people-led and biodiversity-based.
- Engineered: technological approaches that use chemical and physical processes to remove carbon dioxide, including directly from the atmosphere (e.g. DACCS) or from biomass, and store it in geological isolation from the atmosphere on a very long-term basis. Geological storage can be a more permanent removal option than other methods.
- Biological: enhances or manipulates living systems to promote the net removal of carbon dioxide from the atmosphere, storing carbon in vegetation, soils and sediments. Ecosystems can be affected by societal and climate impacts in the future, so these removals are generally considered less permanent.
- Nature based solutions: are a subset of biological removals that provide local benefits for biodiversity and people. Examples include protection and restoration of native forests and wetlands, including peatlands and mangroves.
- BECCS: bioenergy with CCS combines biological uptake of CO2 with geological storage via the combustion or fermentation of harvested biomass and capture of the resulting CO2. This could be considered engineered or biological.
Purchasers of carbon credits
Carbon credits are voluntarily purchased in the UK by businesses, cities/councils/regions and, to a lesser extent, citizens.
Businesses
- Most global demand for VCMs comes from the private sector, driven by their voluntary Net Zero commitments and products offering consumers the option to ‘offset’ the emissions resulting from their purchases.
- There has been a substantial rise in Net Zero commitments. 60% of FTSE100 companies had committed to a Science Based Target in 2021 (one third in 2020).
- A third of FTSE350 firms include ‘offsets’ in their published emissions reduction plans. Of the FTSE350 who disclosed the size of reliance on ‘offsets’ in their latest report, it is estimated the ‘offsets’ cover a significant proportion of their emissions (between 36% and 80%, depending on estimation methods).
Councils, cities and regions
- Nearly two thirds of local councils in England aim to be carbon neutral by 2030. Aggregated data on demand for ‘offsetting’ from local authorities is limited, but anecdotally many are seeking to use ‘offsets’ in their Net Zero plans. Around 15% of cities and around 30% of states/regions globally planned to use ‘offsets’, out of those reviewed by ECIU and University of Oxford.
Citizens
- Aggregated data on demand for ‘offsets’ from individuals is limited. Studies have found a high consumer willingness to favour products claiming green credentials, but a very low willingness to pay to ‘offset’ emissions from flights.
VCM Size and value
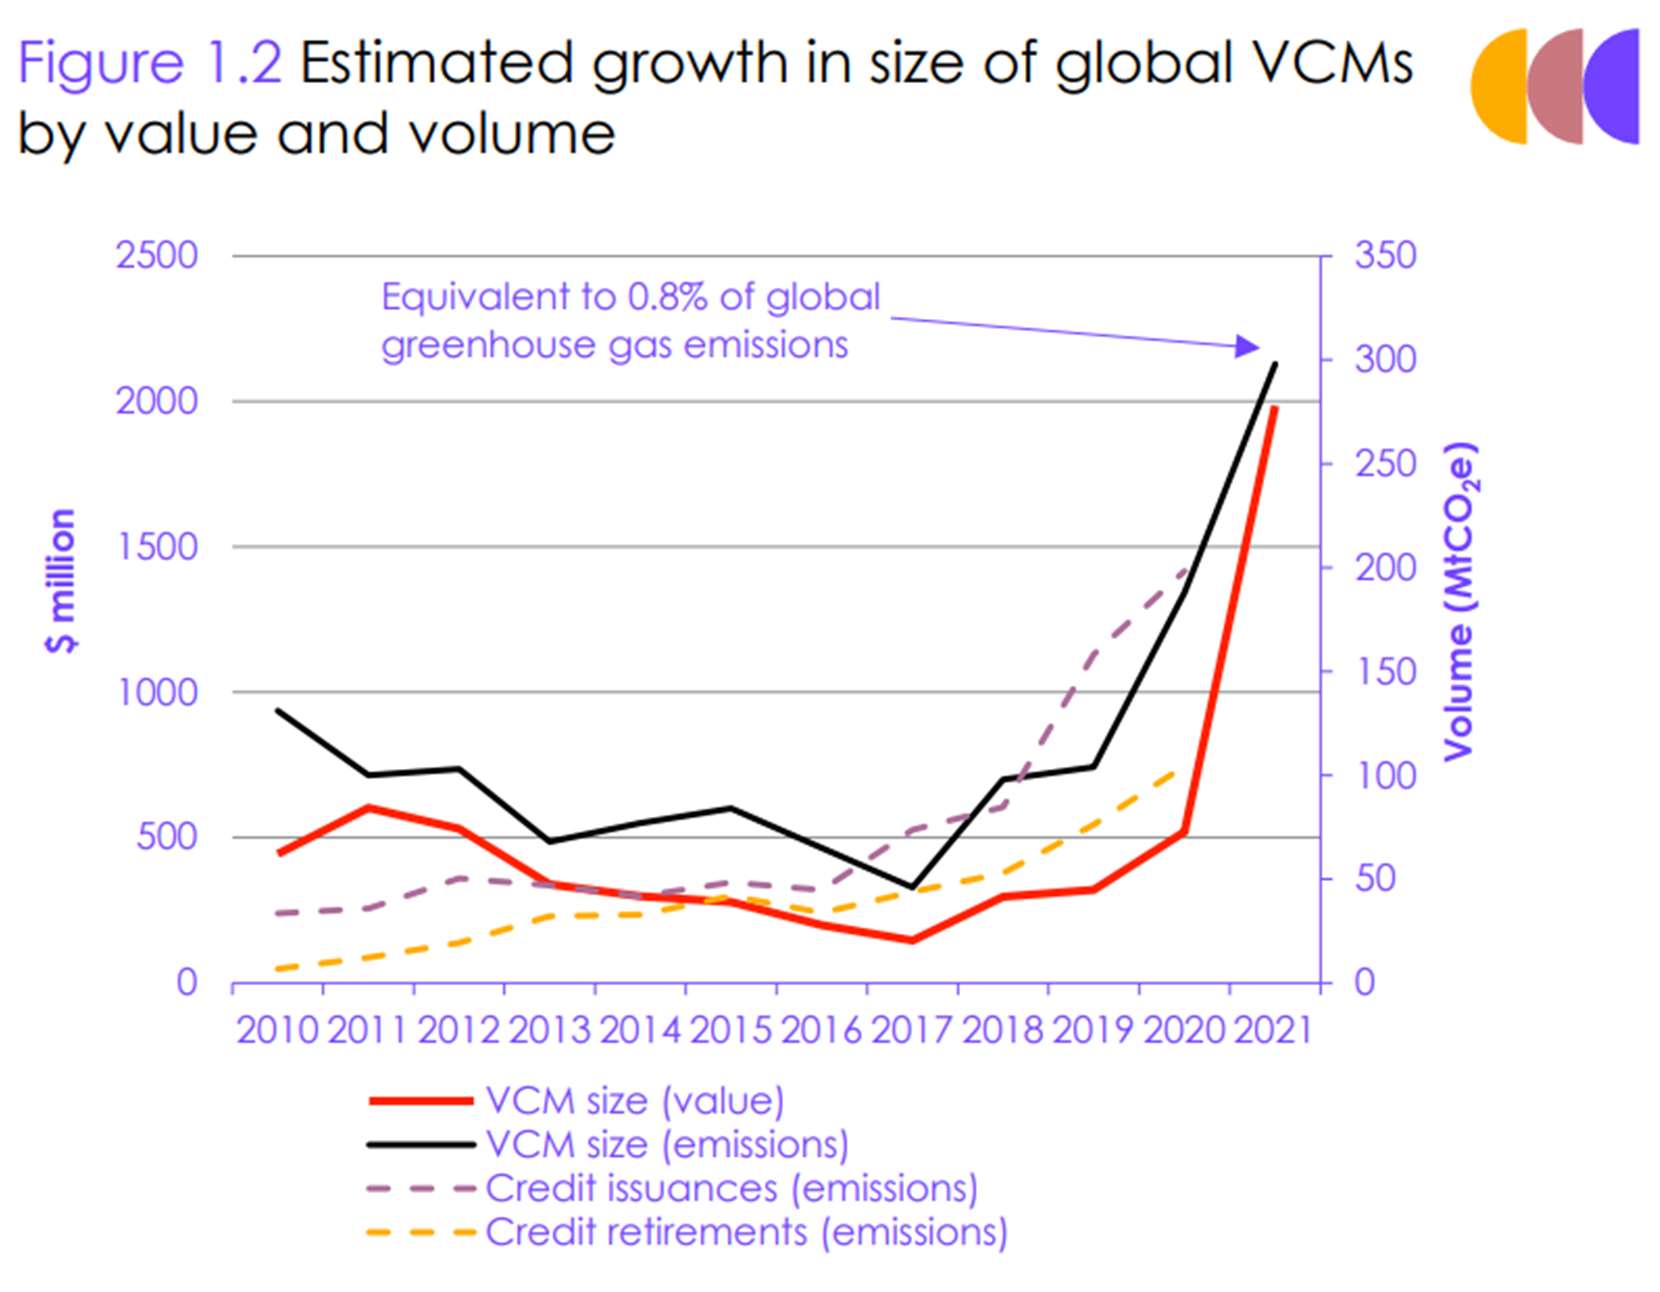
Compared to global compliance schemes, VCMs are small in terms of both emissions and financial value.
- Ecosystem Marketplace estimates the global VCM volume for 2021 was around $2 billion in value (as of Dec 2021) and almost 300 MtCO2e in terms of emissions (as of Nov 2021). This is equivalent to 0.8% of estimated global CO2 emissions in 2021.
- In 2018, voluntary carbon market volume was around 2% of global emissions trading schemes and global carbon tax coverage in terms of emissions coverage.
(Climate Change Committee, 2022).
Market growth
Ambitious projections?
Some estimations suggest demand for global carbon credits could grow by up to a factor of 100 by 2050. However, this is based on large assumptions about business behaviour and how the policy landscape will develop.
- For example, growth projections are largely derived from assumed future carbon credits demand from oil and gas companies and the aviation sector. Also, business emissions reduction plans are not binding and the level of reliance on carbon credits may change due to regulations, costs or reputational pressures.
Low prices
Prices for carbon credits remain relatively low, although UK land-based credits are more expensive than global averages.
- Global carbon credit prices are estimated at around $3/tonne on average although prices vary between $1 – $15/tonne based on type, size, location and accreditation standard.
- In the UK, land-based carbon prices are based on Pending Issuance Unit (PIU) prices, rather than verifiable carbon units. PIUs under the Woodland Carbon Code range between £10 – 20, and £10 – 12 under the Peatland Code. To compare, the cost of a carbon permit contract under the EU ETS has ranged between roughly $50 – $100 in the last year, while the Committee’s Sixth Carbon Budget analysis expected peat restoration to cost £5-40/tCO2 and afforestation £65-105/tCO2 in 2035.
(Climate Change Committee, 2022).
Policies and frameworks
UK specific policies are nascent but starting to emerge:
- Net Zero Transition Plan Standard. The UK will require listed UK companies to disclose their Net Zero transition plans from 2023. It remains to be seen what the guidance will be for the use of carbon credits for net emissions claims.
- UK Environmental Reporting Guidelines. Guidance asks firms to report gross emissions as a headline figure, and although they cannot consider credits from UK woodland projects as ‘offsetting’ their emissions, they can report emissions savings from these. If they have purchased and retired emissions reductions meeting the guidelines’ ‘good quality emissions criteria’ these can be reported in their net emissions.
- Evidence gathering. In 2019 the Government gathered evidence on whether to require transport providers to offer customers the option to ‘offset’ their carbon emissions. In 2021 the Government’s Decarbonising Transport strategy stated this would not be required, to maintain a focus on reducing direct emissions.
- CMA Green Claims Code. The Competition and Market Authority (CMA) published a Green Claims Code in 2021 to ensure businesses comply with the law in communicating their green credentials. They committed to carrying out a full review of misleading green claims in 2022 and have recently announced investigations in the fashion retail sector. For future claims (such as ‘Net Zero’ claims) businesses are expected to demonstrate clear specific pathways, with milestones, and be clear on the level of reliance on ‘offsets’. The prices of carbon credits are substantially lower than other carbon prices, particularly for carbon credits from overseas. There are some policies being developed in the UK and internationally relating to carbon credits and ‘offsetting’.
- Ecosystem Market Framework. The Government is soon expected to announce details of the Ecosystem Market Framework, developed to underpin integrity in existing and developing nature-based codes. Standards that outline the minimum requirements for codes to be considered ‘high integrity’ will act as the core of the Framework.
- Devolved Administrations. UK Environmental Reporting Guidelines cover the UK. Voluntary carbon markets are an area of reserved policy, for both UK voluntary carbon markets (such as UK land-based codes) and for international codes operating in the UK.
Basics and understandings
Net Zero commitments
60% of the FTSE 100 have voluntarily committed to reach net zero by 2050 under the UN’s Race to Zero pledge, requiring them to reduce and/or compensate emissions partly by supporting UK climate action. In 2019, the top 10 companies by revenue emitted 90 million tCO2e (Scope 1 and 2) alone.
The Woodland Carbon Code
Since 2011 the WCC has been the UK standard for quantifying emissions reduction from woodland creation projects. The WCC provides a rigorous set of methodologies and procedures for landowners and developers to follow, to ensure credibility of carbon units. Projects must demonstrate successful woodland establishment, with tree growth and sequestration rates assessed at year five and then every ten years. Woodland Carbon Code schemes may last between 35 and 100 years.
Additionality
Under the WCC, projects must be judged as additional in order to be granted any carbon credits. This is a crucial rule that massively narrows the scope for successful project developments. Additionality is used to mean carbon sequestration over and above that which would have happened if no payments had been made for carbon credits. This principal is critical to the credibility of the WCC. They argue that buyers of carbon units want to know that their input has enabled more carbon sequestration than would otherwise have happened under existing legal, financial and business circumstances.
Under the financial additionality test, a project is only ‘additional’ if it requires carbon income to be financially viable. Where new woodlands have little or no revenue opportunities, it is much easier to show that payments for carbon credits are needed to make them viable. However, where a project has significant revenue opportunities, say from timber production, it is vital that due diligence is applied as to whether carbon payments are needed. Within this additionality test, carbon revenues need to be at least 15% of development costs and the project seen as being economically unfeasible without carbon finance unless other barriers to implementation exist. These tests, currently under review by the WCC, could impact the eligibility of some commercial forestry projects, which have become popular amongst new carbon-focused institutional investors.
“The purpose of carbon markets is to drive additional action towards climate change targets. Without additionality, they have no purpose.” Pat Snowdon, Head of Economics and Woodland Carbon Code at Scottish Forestry (Scottish Forestry, 2022).
On top of this, projects will not be given the go-ahead if timber harvesting is predicted to generate more money than the carbon credit sales. This leaves broadleaf trees as the only viable option which are not nearly as appealing to plant for profit seeking landowners and forestry companies. Should a forestry owner wish to sell the carbon credits on spruce for example, they would have to leave the timber standing well beyond its harvesting window to ensure proceeds would not exceed that of the credit sales.
Verification and PIU-to-WCU Conversion
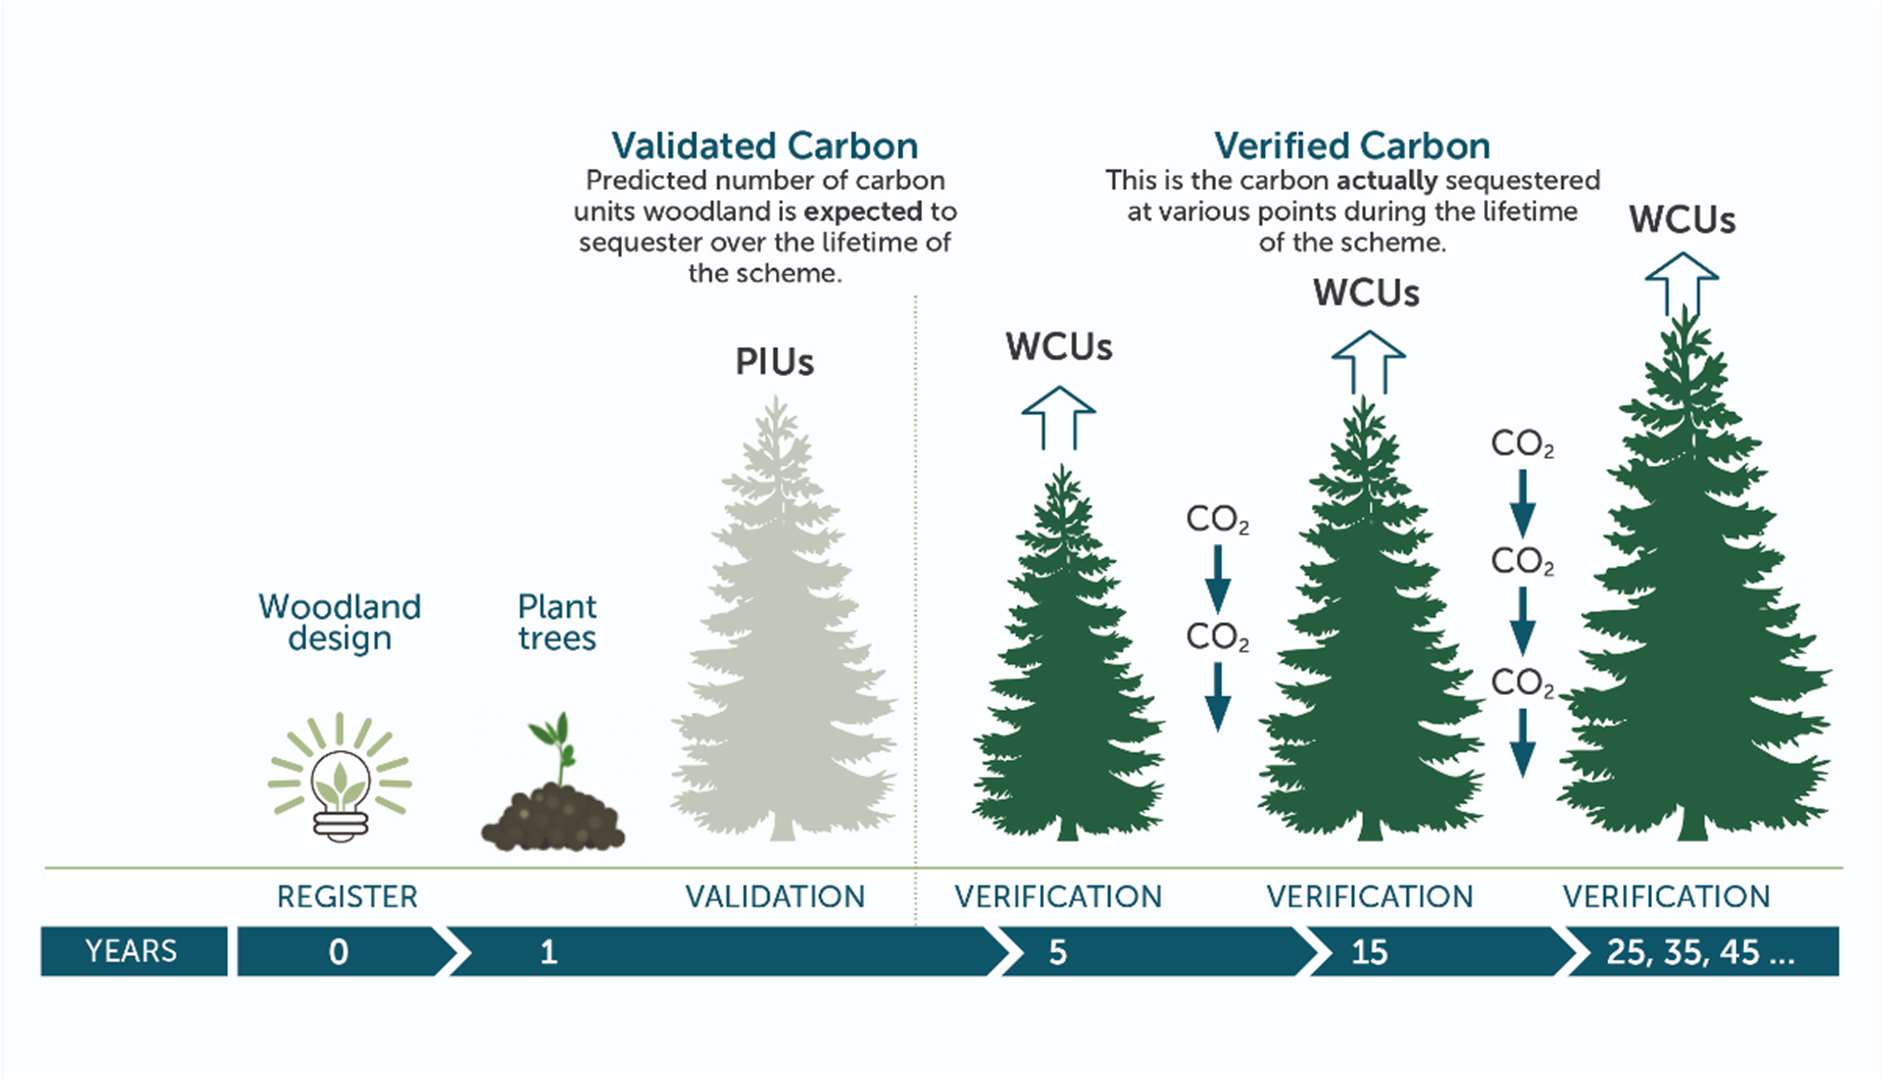
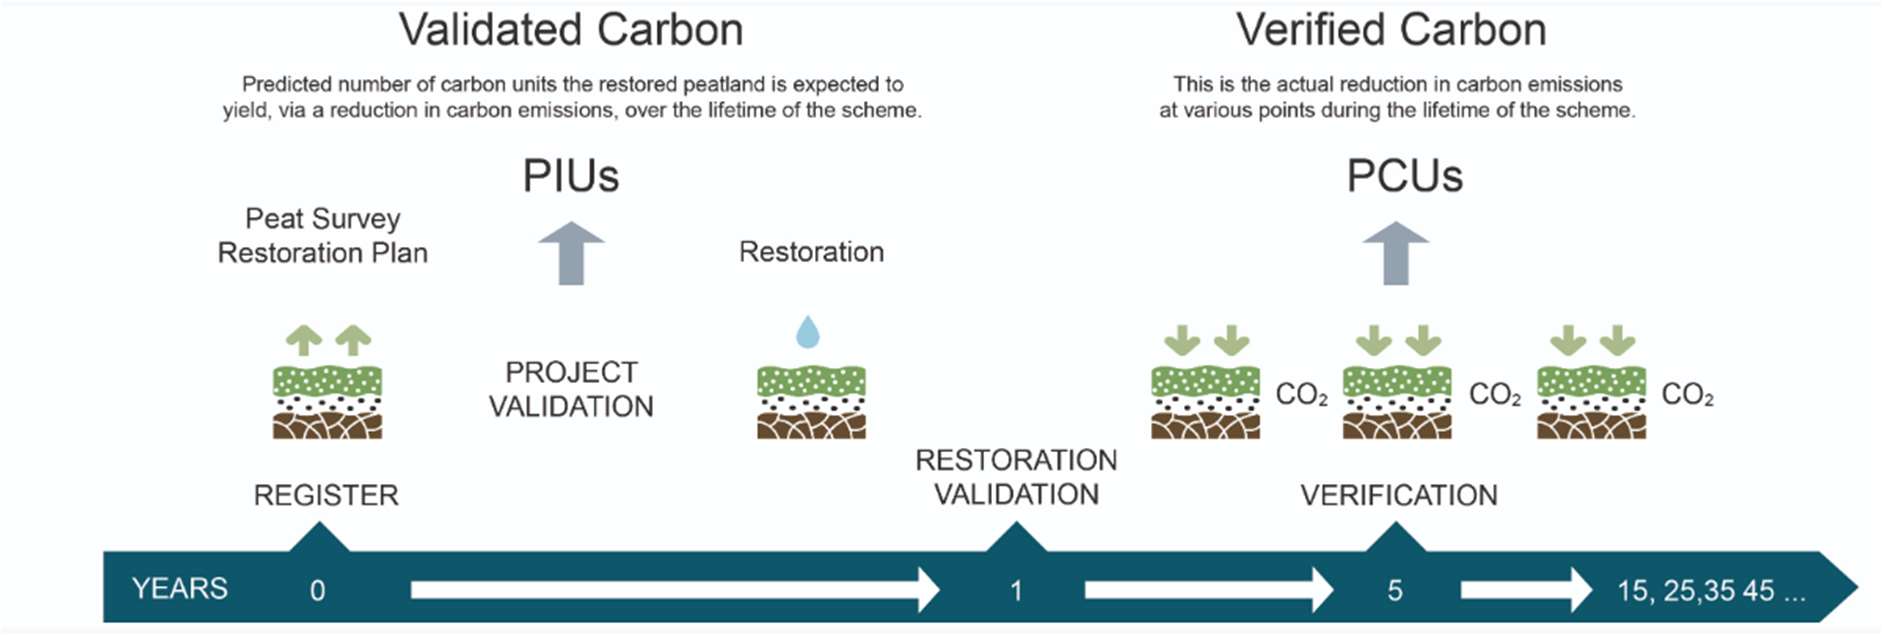
The UK WCC allows landowners to monetise projected carbon benefits of their project soon after their project has been implemented rather than waiting for future verification events. Pending Issuance Units (PIUs) can be sold to buyers as soon as the project start date.
A PIU corresponds to a promise of a carbon credit to be delivered in the future (also known as “ex-ante” issued credits). PIUs cannot be used for carbon offsetting purposes until they are converted and retired after verification events into Woodland Carbon Units (WCUs).
To account for a level of uncertainty in carbon outcomes over long periods, the UK WCC and PC (peatland code) requires each project to hold approximately 20% of volumes as a reserve pool (or insurance buffer) known as the PIU reserve or W/PCU reserve, when converted. These units are stored in a ‘bank’ of unclaimed units to cover losses should a woodland or peatland project fail. Projects under the WCC contribute 20% of their net carbon sequestration, while PC projects contribute 15% of net GHG emissions reductions over the project duration. This safeguards the investment made by purchasers of carbon units and helps the amount of carbon claimed to persist for the long-term.
Verification occurs initially five years after planting and thereafter up to every ten years. At each verification, the auditor verifies claims made by landowners and developers, approving the conversion of PIUs to WCUs and PIU reserve to WCU reserve. Thus, all of the units generated will initially be classed as PIUs. As the woodland grows and sequesters carbon dioxide a growing proportion of these PIUs are then converted into WCUs.
PIUs enable carbon project developers to monetise all the ex-ante carbon credits over the (up to 100 year) project lifetime. This can create an incentive misalignment between developers and corporate buyers. Risks include developers no longer interested in or able to afford project monitoring, maintenance or verification in later years, causing the project to fail.
Whilst project developers budget for a 20% risk buffer and a level of conservatism in assumptions of carbon delivery over such long project timelines, there remains a risk that buyers may never see all of their PIUs converted into verified credits.
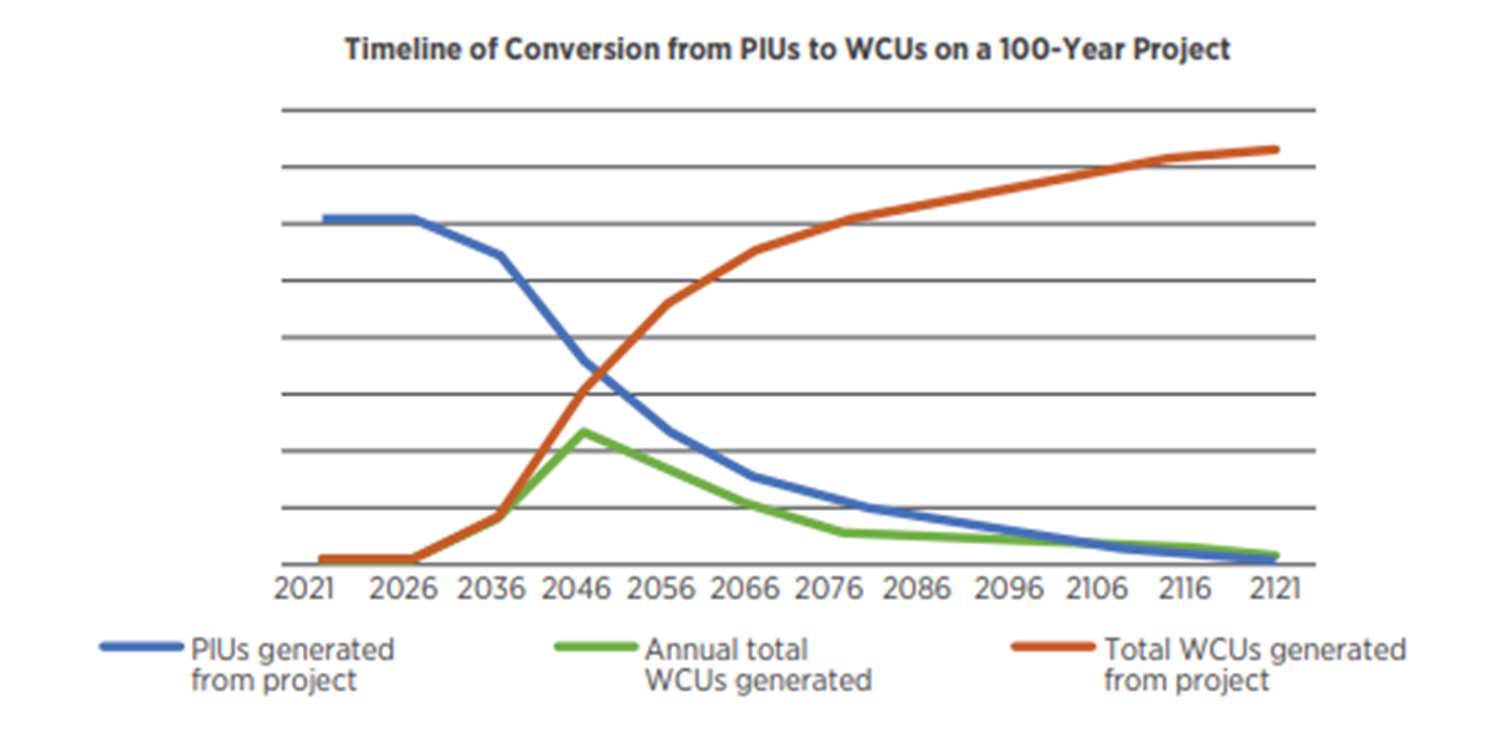
The below chart illustrates the conversion of PIUs to WCUs on a 100-year project (first 100 years). The blue line shows the total PIUs generated from the project, the green line shows the annual total WCUs generated from the project and the red line shows the cumulative WCUs generated from the project. WCUs are verified PIUs. Once the woodland has reached its carbon sink period (year 5 to year 100), WCUs can be generated.
Moreover, most tree species are at the peak of their carbon sequestering capability when they are between 16 and 25 years old, hence the sharp rise between 2036 and 2046 followed by a subsequent decrease in WCUs generated thereafter (see below) (Strutt & Parker, 2022).
Sequestration rates
Annual carbon sequestration rates of new woodlands in the UK are lower relative to other geographies. Forests in the UK sequester an average of 5tCO2e per hectare per year, three times less than fast-growing tropical forests.
Trees do not sequester carbon at a steady rate. There are three carbon sequestration cycles in the life of a tree:
- Carbon source period = 0 – 5 years – tree releases more carbon than it sequesters.
- Carbon sink period = 5 to 100 years – tree sequesters more carbon than it releases (with 16 – 25 years being the peak of carbon sequestering capability for many tree species).
- Carbon store period = Year 100 onwards – amount of carbon released equals that sequestered (see example diagram below).
(Scottish Woodlands, 2022).
To calculate predicted carbon sequestration from a project registered under the WCC, the WCC Carbon Calculation spreadsheet can be used. The results are checked at validation and re-assessed at the verification stage. Further guidance on carbon calculation from woodland projects is available on the Woodland Carbon Code website.
An example under the WCC: If 10 hectares of arable land was converted to native woodland under the WCC, the sequestration over 100 years would be circa 7,900 tCO2e, of which 6,320 tCO2e can be sold (as 20% or 1,580 tCO2e would go to the WCC Buffer).
The Woodland Carbon Guarantee is available for woodland planting in England only. It provides a guaranteed index linked price for verified Woodland Carbon Units (WCUs), until 2055. If an owner prefers, units can still be sold on the open market rather than to the government. It operates by reverse auction with various auction rounds throughout the year (Scottish Woodlands, 2022).
Current projects under the WCC
- 18.5 kha of woodlands have been validated and verified under the WCC. The 2019 Woodland Carbon Guarantee led to a significant uptick in the registration of woodland creation projects in 2020. Over 30 kha are listed as ‘under development’.
- If successfully delivered, the current registered WCC woodland projects could sequester 15.4 MtCO2 over their lifetime (up to 100 years).
- If registration of WCC projects continue at the current trend, and are aligned to UK tree planting targets, then the Code could support establishment of around 260 kha of new woodland by 2050 (Climate Change Committee, 2022).
With no changes to the existing supply, total predictable credit volumes account for 6.26 million. If including new projects under development, the market is expected to see another 19 million credits over the next 100 years (17.43 million from woodland and 1.57 million from peatland) (Maxwell, 2022).
See here for current WCC project developers, location and further information: https://www.woodlandcarboncode.org.uk/buy-carbon/woodland-carbon-projects.
Maxwell (2022) clearly shows the highly concentrated project developer ecosystem:
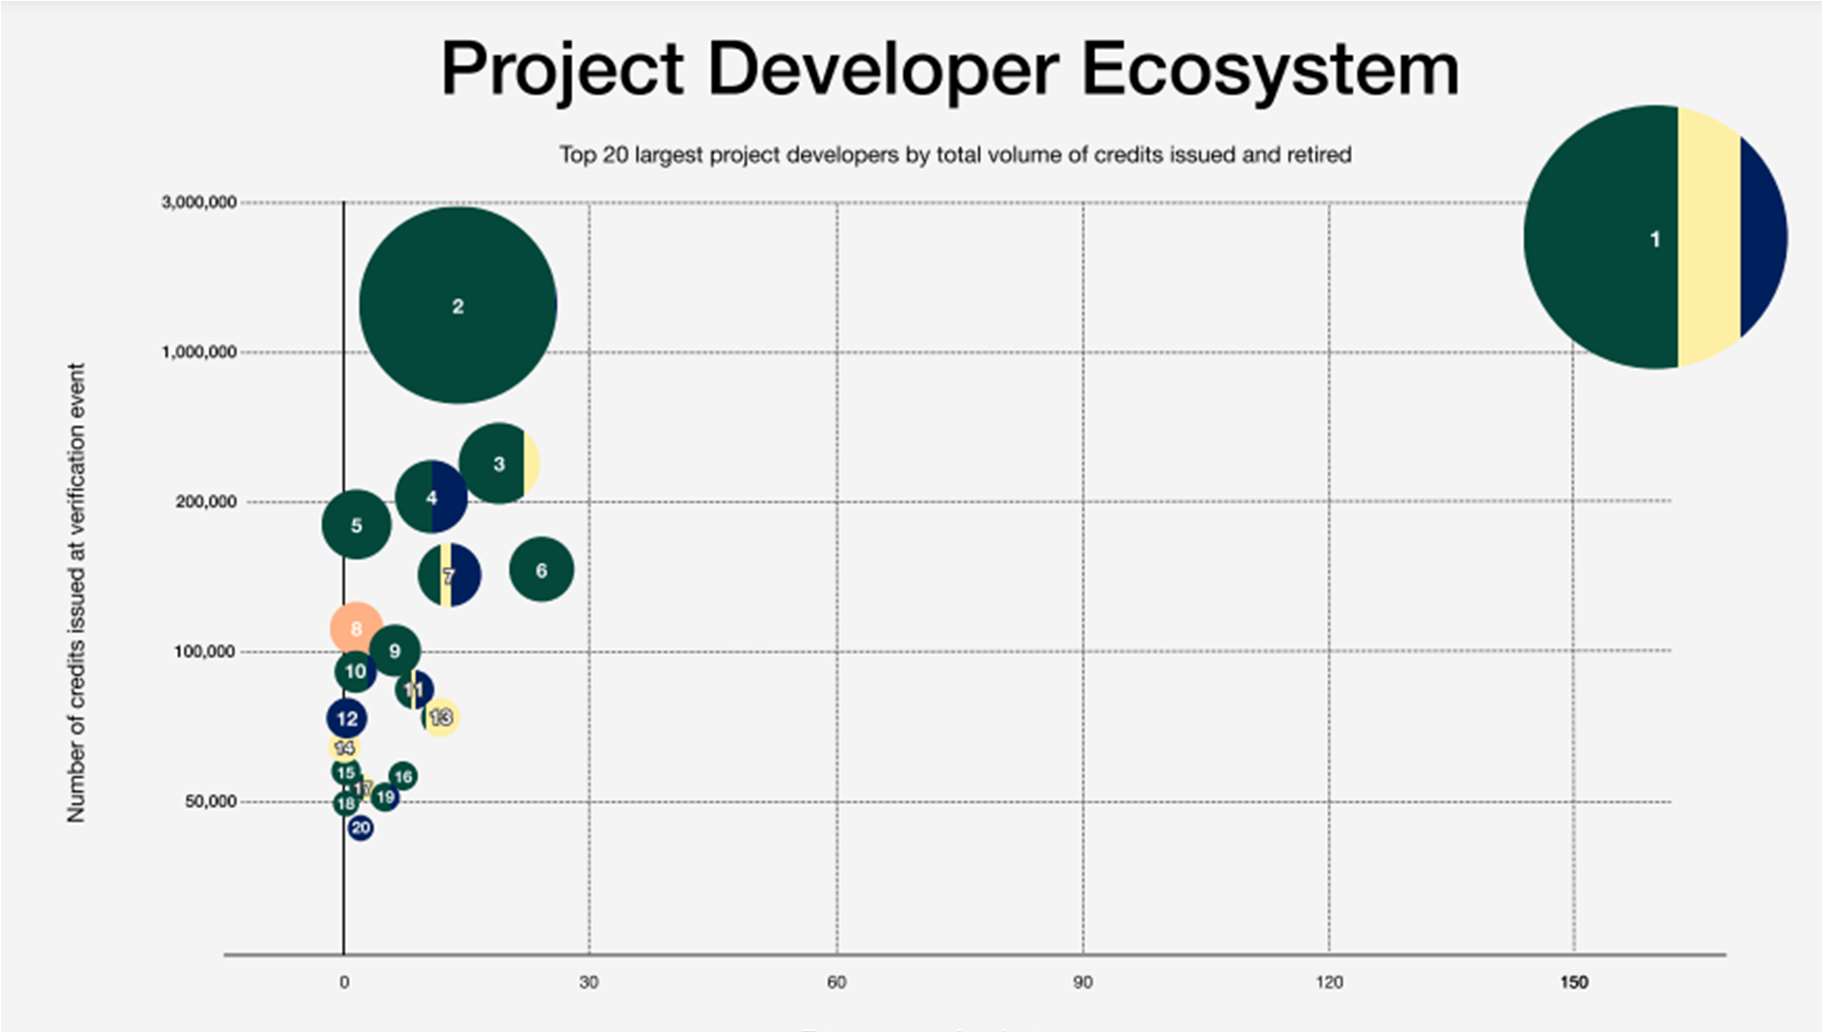
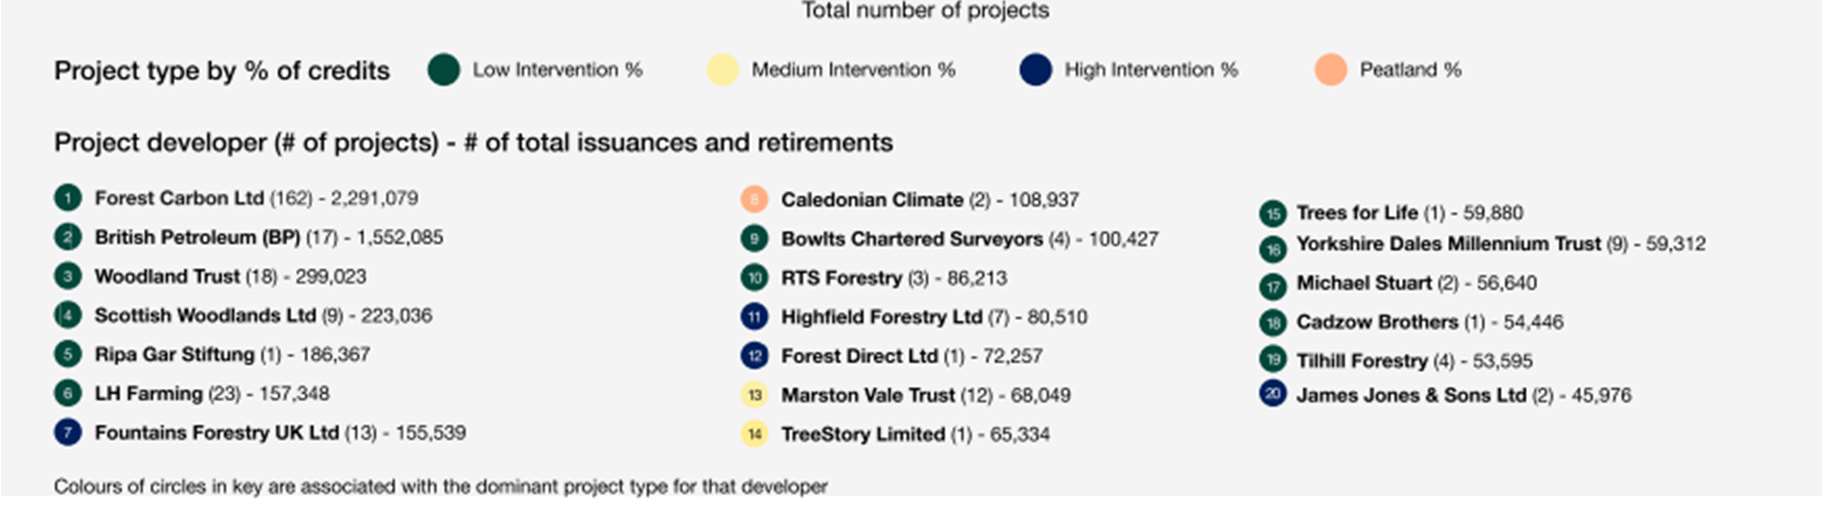
- The top 2 developers, Forest Carbon and British Petroleum (BP), account for 61% of total issuances and retirements to-date. The top 20 account for 92%.
- Largest portfolios are held by organisations who were key early contributors to the development and creation of the Woodland Carbon Code since its inception in 2011.
- The developer ecosystem has seen recent market entrants. Out of 168 developers, only 55 have issued or retired credits. The remaining 118 have submitted projects which are still considered under development.
- Forest Carbon, BP and Scottish Woodland Ltd are expected to solidify their market share, however large investment funds and landowners are also on the rise.
The Peatland Code
The majority of the UK’s peatlands are no longer sequestering and storing carbon. Due to decades of unsuitable land management practices, it has instead become a significant net source of Greenhouse Gases (GHG) currently emitting approximately 16 million tonnes of carbon dioxide equivalent (CO2e) each year. This is equivalent to around half of all the reduction efforts made annually in the UK. Preventing further damage and restoring healthy ecosystem function can therefore play an important role in climate regulation within the UK. Conserving and restoring peatlands also prevents loss of biodiversity and helps to enhance water quality.
The Peatland Code was developed in 2015 and managed by the IUCN Peatland Programme. Projects use established emission factors to estimate baseline emissions and restoration abatement. Field surveys at year 5 and every 10 years that follow are required for verification. The peatland code works almost identically to the WCC as it sets out a series of best practice requirements including a standard method for quantification of GHG benefit. Independent validation to this standard provides assurance and clarity for buyers with regards the quantity, quality of emissions reductions purchased. Recognising that carbon benefits arise for many years after the initial restoration activities are implemented, the Peatland Code also ensures the carbon benefit will be regularly measured and monitored over the lifetime of the project (minimum 30 years). The emissions reduction benefit from restoring peatlands is permanent and linear therefore the carbon yield is the same ever year for the whole duration of the project. Buyers can therefore be confident in purchasing peatland carbon units upfront, enabling the restoration project to take place. Peatland credit volumes are tied to the emission reductions from peatland restoration and can be available in large volumes, however development of peatland projects has only begun as of 2018.
Sequestration rates
Peatlands are carbon-rich wetlands which occupy 3% (circa 4 million km2) of the global land surface and 12% of UK land area. Worldwide, they store more than twice as much carbon as all existing forests.
When peatlands are in their natural water-logged state, they capture CO2 from the atmosphere through photosynthesis and their plant material only decomposes partly, meaning that it does not release CO2 back into the atmosphere.
In the UK, it is estimated that peatlands alone store circa 3.2 billion tonnes of carbon. However, due to past and present management of peatlands, they are at present sources of carbon emissions (currently contributing to circa 4% of UK’s total annual greenhouse gas emissions) (Strutt & Parker, 2022).
(Scottish Woodlands, 2022).
Current projects under the PC
The Peatland Code has seen recent rapid growth with a tripling in the number of projects registered in the last year and all registered projects are now predicted to deliver WCU 4,681 tonnes of CO2e emissions reductions over their project lifetimes
- As of April 2022, 12.4 kha of peatland are registered under the PC. Of this, 1.6 kha have been validated (restoration in progress) and 10.8 kha are under development or pending review (see Figure 3.5).
- Twelve projects have been validated and could reduce emissions from degraded peatlands by 0.25 MtCO2e over the project lifetime (averaging at 70 years). Projects under development and forecast to start in 2023/2024 could abate 1.9 MtCO2e if successfully established (average project length 85 years).
- As of July 2022, the Peatland Code now has 100 projects registered under the UK Land Carbon registry. These projects are securing 14,471ha of peatland restoration in Scotland, England, and Wales. In 2022 alone, 36 projects have already been registered with many more under development.
See here for current PC project developers, location and further information: https://www.iucn-uk-peatlandprogramme.org/projects-map.
Soil
Soils codes tend to focus on regenerative farming practices aiming to diversify income streams for farmers while keeping land in production. Six companies are currently engaging with UK farmers in this area, but transparency is lacking, making it difficult to estimate the farmland area involved and the credits generated.
In July 2021, the Environment Agency awarded a grant to a consortium of farmers, academics, technology businesses and NGOs, including the Sustainable Soils Alliance, led by FWAG to develop and pilot the UK Farm Soil Carbon Code.
In the UK, there is currently one operational scheme and various in development, for generating carbon credits from regenerative agriculture practices. Other schemes are operational in Europe.
Sequestration process
At the moment, there is no soil carbon code due to the complexity of the variation of soil carbon sequestration rates, and therefore there is no UK template on how best to measure it. However, different soil carbon dynamics models exist such as Henin-Dupuis, RothC, Century and AMG. Any of these models can be used to assess soil carbon sequestration but long-term estimations are difficult.
Soils are made in part of broken-down plant matter. This means they contain a lot of carbon that those plants took in from the atmosphere while they were alive. Especially in colder climates where decomposition is slow, soils can store—or “sequester”—this carbon for a very long time. If not for soil, this carbon would return to the atmosphere as carbon dioxide.
Cropland, which takes up 10% of the Earth’s land, is a major target for soil-based carbon sequestration. Farmers can add more carbon to agricultural soils by planting certain kinds of crops. For example, perennial crops, which do not die off every year, grow deep roots that help soils store more carbon. “Cover crops” like clover, beans and peas, planted after the main crop is harvested, help soils take in carbon year-round, and can be ploughed under the ground as “green manure” that adds more carbon to the soil. Farmers can also do less intensive tilling. By breaking up the soil, tilling prepares land for new crops and helps control weeds, but also releases a lot of stored carbon.
Limitations
Climate change is also making it harder for soils to naturally store carbon. The warming of the planet could lead to widespread soil carbon losses by speeding up the decay of soil organic matter. We are already seeing this happen in the Arctic as permafrost, or permanently frozen soil, thaws. This release of CO2 to the atmosphere could become a self-reinforcing feedback loop, where lost soil carbon warms the Earth, causing soils to release even more carbon.
Price
Carbon prices across the land-based codes range between £10 and £40 tCO2e.
- WCC: the carbon price reflects site specific aspects of the woodland creation project, such as planting and management costs and other benefits it may provide. The cost of pending issuance units range between £10 and £20 /tCO2e.
- The Woodland Carbon Guarantee (selling credits to the government) provides a guaranteed price on delivery of verified Woodland Carbon Units every 5 or 10 years up to 2055/56. The average price per unit in 2021 was £19.22.
- Vintage PIUs (PIUs between verification stages in order to be converted to WCUs) are selling at a premium of circa £30 per PIU.
- It is expected that prices will increase as pressures to achieve net zero targets will increase demand in the coming years. A report from LSE and Grantham Research Institute suggested that, to meet net-zero targets, shadow carbon prices would increase to circa £75/tCO2 in 2030 and to circa £160/tCO2 in 2050.
- PC: yet to issue verified Peatland Carbon Units. The price of peatland PIUs is approximately £10 – £12 tCO2e23, though peatland projects have recently reached comparable prices to woodland.
- Soil: Interviews with those working in the agriculture soil market suggest that soil carbon credits average at £30, with a range of £23 – £40 reported.
Current prices mean woodland creation (for objectives outside timber production) and peatland restoration projects are unlikely to be viable on carbon prices alone. The stacking of ‘carbon credits’ funding with public subsidies or levering private investment in other areas of natural capital that recognise broader ecosystem benefits could support the economic viability of project while potentially increasing their resilience.
Voluntary carbon markets, including the two land-based codes above, are an area of devolved power. Inward investment to the Peatland Code and Woodland Carbon Code from overseas investors is not currently permitted.
Demand
In order to analyse potential demand, AlliedOffsets (2022) examined the reports of FTSE 350 companies. Encouragingly, most companies had provided information on scope 1, 2, and 3 emissions, and many had charted a pathway towards reducing those emissions. However, there were inconsistencies in how companies report the data, making it difficult to draw out clear comparisons or to pull out a market-wide overview. For instance, most companies did not break down their emissions by country, meaning it’s difficult to understand where the emissions should be counted. Some companies reported carbon intensity, rather than the overall amounts. Some broke down scope 2 emissions as location and market-based, while others did not.
Few companies make clear what emissions they offset, with most indicating that they offset ‘residual’ or ‘hard-to-abate’ emissions, if they report the information at all. Some make clear what projects they offset with, but most only make vague statements about offsetting. Of the companies that make clear the number of credits they are offsetting, on average, they offset 36% of their scope 1 and 2 emissions (according to the latest data shown in the annual reports).
Furthermore, it’s not immediately clear what percentage of the economy FTSE 350 companies are responsible for, making it difficult to extrapolate across the wider UK economy. AlliedOffsets (2022) made the assumption that these companies are responsible for around 50% of the overall demand for carbon credits in the UK, given their prominence in the UK economy; however, they encouraged users to alter the assumptions and examine how the updated figures affect the overall supply and demand for carbon credits.
Outlook for the UK market
The outlook for the market appears to show growth in the number of projects created and credits sought. Given the increased demand from corporates, and given that it’s unlikely the number of projects in the UK will be able to meet UK companies’ demand; this is likely to continue to push prices up for projects.
WCC and PC are still early on in their establishment, and there is recognition that the codes will shift and change as they move forward. Earlier this year, for instance, Scottish Forestry made the listing requirements more stringent, which likely means a slowdown of registered projects. Ensuring that there is trust in the underlying carbon reductions taking place due to the projects is key, and while there is a reputation that the codes offer quality credits, this is likely to be scrutinised further as more projects begin to issue and sell units. There is also a seeming lack of understanding among buyers of the difference between PIUs and WCUs, with only the latter being eligible for offsetting current emissions. Instead, brokers assign future credits, but note that the credits are being used to offset past emissions. (For instance, ‘Assigned by Forest Carbon Ltd. Woodland creation supported by Zennor Petroleum Limited in recognition of its 2019 calendar year Scope 1 & 2 emissions. Credits will be automatically retired as they are verified.’)
Emerging soil carbon companies are currently competing to sign up farmers, and they do not report data to any registry. Some are currently selling certificates or other instruments, careful to not label them as ‘offsets’. As there is no centralised code, each company takes a different approach in creating a baseline and measuring carbon reductions, though most base their analysis on one of existing soil carbon methodologies globally. Not wishing to crowd out the private sector, the Soil Carbon Alliance is setting up guidelines for the companies to adhere to, instead of establishing a centralised code like the WCC. While this is likely to spur innovation, it will also make it difficult to create consensus around what a ton of soil carbon represents, with multiple entities setting up multiple products at different price points. If one company is found to be issuing credits without applying proper rigour to its measurement, it can make it difficult for other, more meticulous companies, to sell the credits their farmers generate.
Across all project types, there is an ongoing debate about whether and how to enter the market. While there is interest among landowners and farmers in farming in more sustainable ways, and a need to supplement income, there is also a hesitation to part with any credits they generate. Some are waiting for the industry to take firmer shape, while others are conscious that by selling their credits today, they may need to purchase credits themselves in the future, if they will need to be carbon neutral themselves.
Landowner guidance
Strutt & Parker (2022) lay out some simple steps of advice for landowners looking to sell their carbon credits:
How do I find someone to buy my carbon?
- In England, you can sell carbon units to the government through DEFRA’s Woodland Carbon Guarantee (WCaG) auction. Projects must be registered under the WCC. Successful sellers are offered agreements at a guaranteed index-linked price for 35 years. This gives the seller the option to sell their units to the government at the guaranteed price – but they don’t have to if they don’t want to. It therefore gives them greater certainty. Payments would be made every five or ten years when verification has happened. Auctions take place every six months approximately.
- Register projects on the UK Land Carbon Registry (for WCC and PC) or any other verified programs and be on a public register available to all potential buyers.
- Use carbon brokers or find a private buyer.
Selling basis
Landowners can get paid upfront for afforestation or peatland rejuvenation projects before the carbon has been sequestered or emissions reduced.
Once registered under a code, the landowner can start selling PIUs for future planned offsetting (‘on track to offset emissions’). Every 5/10 years, these units are verified and if validated, they can be converted to WCUs or PCUs. These get sold for current offsetting purposes.
There are circa 12,000 large companies in the UK who are required to undertake greenhouse gas monitoring. The UK Carbon Codes offer them an opportunity to buy carbon credits to compensate current emissions or participate to achieve their long-term carbon neutrality plan.
What to consider before selling your carbon
- Ensure that the verification scheme is of high quality. As there are a small number of acknowledged international standards for verification, it is essential that buyers can rely on a trusted and rigorous process. Good quality offsets must be associated with greenhouse gas reductions that are additional, not overestimated, permanent, claimed by only one entity and not associated with any environmental or social harms.
- Understand the implications that lie within carbon trading. These include considering the consequences for farming economics, interactions with other environmental schemes, effect on the capital value of land and property, tax issues, land tenure issues and the consequences of the land use change to woodland.
- Be aware and keep track of your available carbon credits to sell to avoid double-counting. Once a landowner has sold sequestered carbon, this appears on the buyer’s balance sheet. Landowners should understand how much carbon their land can sequester, how much they are producing on the land and any surplus that can be sold to third parties without detrimentally affecting their position from a financial, environmental and reputation point of view. It is inevitable that supermarkets and food processors will want their own supply chains to be low carbon and if a farmer has sold all of their carbon credits to another emitter for offsetting purposes, they will not be able to use the ‘sold sequestration’ against their own emissions. Be also mindful of double counting in a landlord / tenant scenario.
- Have a contingency plan in place to avoid breaking your contract. Contracts between buyers and sellers of carbon are usually agreements over a long period of time i.e. 30 years. Be aware that if, for instance, a woodland suffers from a fire, the seller would have to still provide the same amount of carbon sequestration as per the terms of the contract. This could mean replanting woodland or supplying it from another source. The WCC has set up a centralised buffer account to which all sellers have to contribute 20% of each project’s carbon credits. This is used as insurance if ever trees in a verified scheme are damaged. Our understanding is that if a landowner sells land used to generate and sell carbon credits, the obligations in the contract transfer to the buyer.
- Avoid greenwashing by knowing your buyer. Greenwashing can happen when buyers offset their carbon but have not first taken steps to offset their avoidable emissions of greenhouse gases and therefore are still major pollution contributors. To avoid getting involved with such buyers, transparency and knowing the buyer is key. If the buyer is greenwashing or intending to, this could damage the seller’s reputation.
Market Activity
As mentioned previously in the forestry section, projects under the WCC are emerging but market activity is low. However, outside the WCC and PC, there has been significant market activity within the UK’s VCM over the last few years.
AlliedOffsets (2022) published and interesting article highlighting the size and activity within the current market. The data shows:
The total number of credits retired by FTSE 350 and non-FTSE 350 companies, as well as the estimated value of those retirements. It shows the data for all time (since 2009) until April 1, 2022; as well as activity in 2021.
| Total | 2021 | |
|---|---|---|
| Retired Credits (FTSE350) | 19,586,099 | 5,973,164 |
| Retired Credits (Non-FTSE350) | 4,248,984 | 1,955,345 |
| Credits Anonymously Retired | 60% | 60% |
| Total estimate for FTSE350 and Non-FTSE350 | 59,587,708 | 19,821,273 |
| Total credits retired globally in 2021 | 196,361,676 | |
| % of UK market participation | 10.1% |
| Total | 2021 | |
|---|---|---|
| Retired Credits (FTSE350) | £162,461,598 | £53,177,231 |
| Credits Anonymously Retired | 60% | 60% |
| Total estimate for FTSE350 | £406,153,994 | £132,943,078 |
| Retired Credits (Non-FTSE350) | £38,378,336 | £17,182,345 |
| Total UK estimate | £444,532,330 | £150,125,423 |
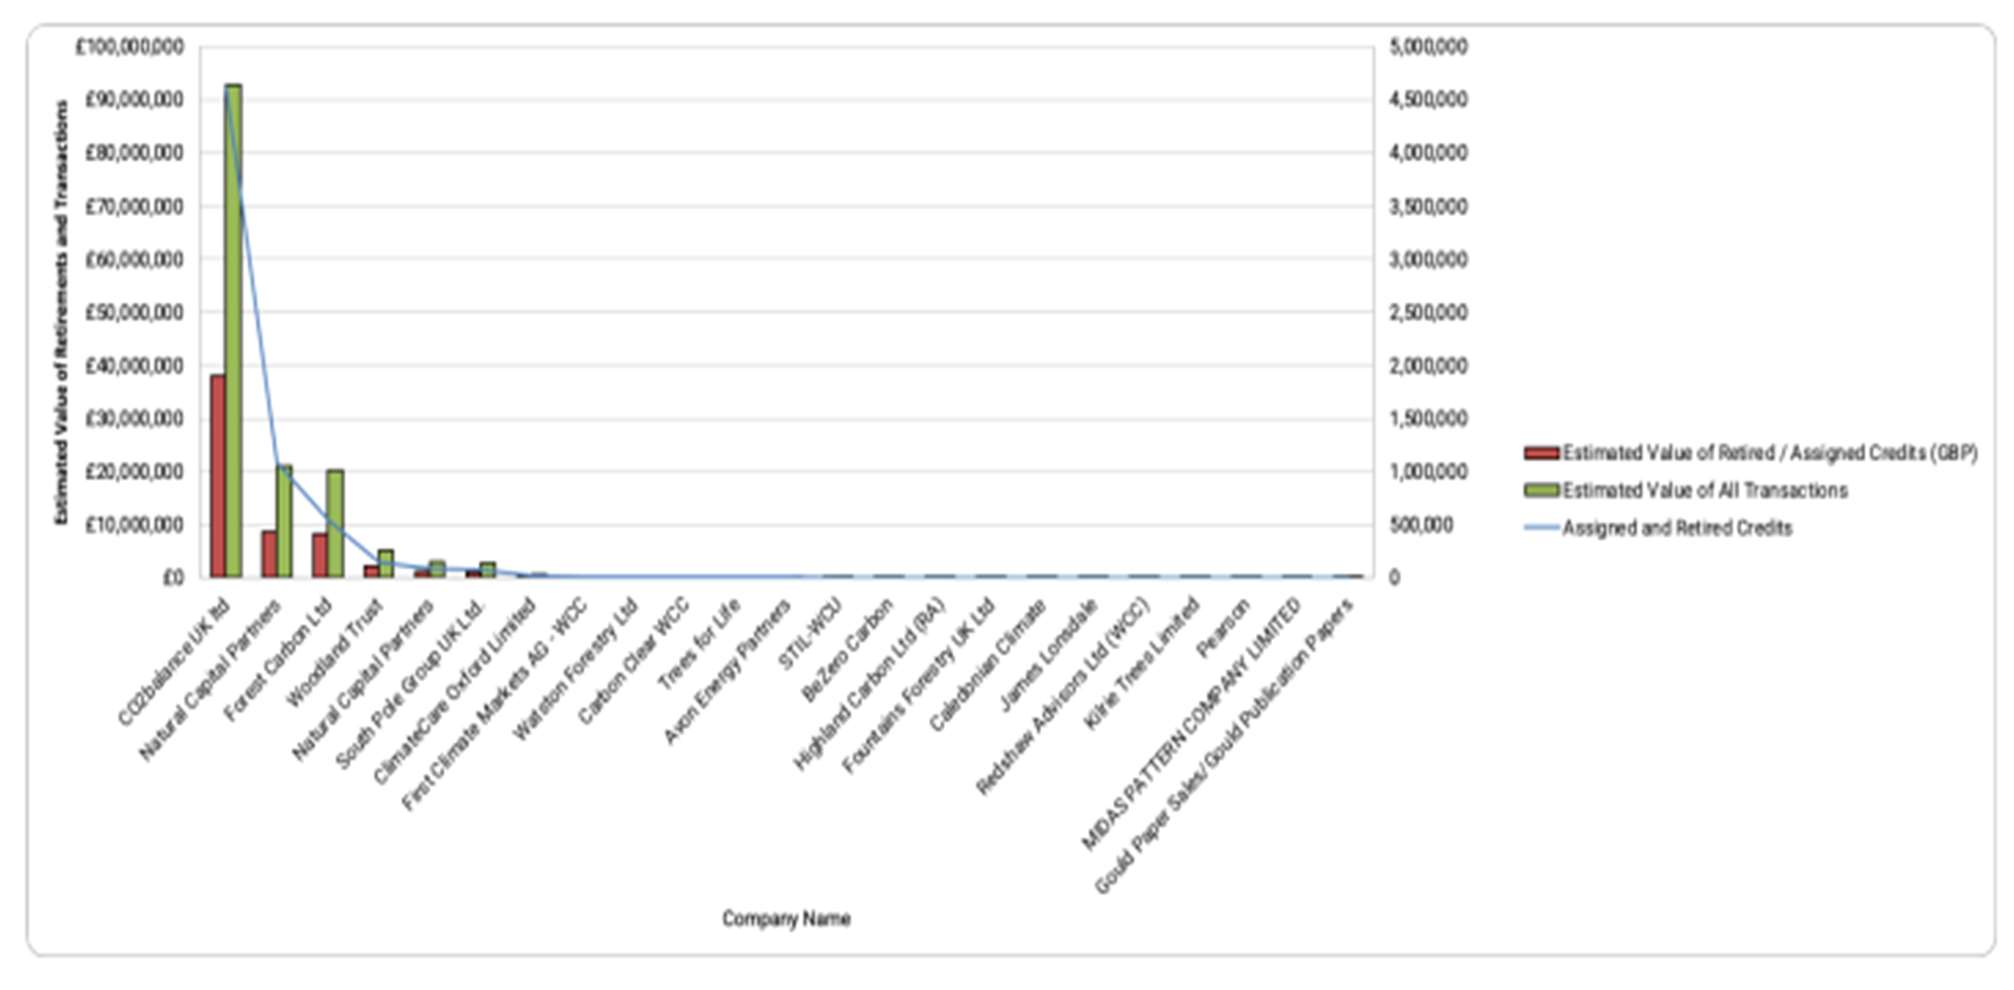
The total number of credits retired by projects with an associated project proponent / developer. This data includes information from 2009 onwards. The first two companies are active primarily on Gold Standard and Verra; the rest are active on WCC and PC.
The total number of companies in the FTSE 350 that plan to use offsets, as mentioned in their annual reports (35%). We also show what percentage of companies actually mention the amount of credits they have purchased (13%). Finally, we took a weighted average of the stated offset quantities, as compared to their total emissions (36%), which equals ~7 MtCO₂e.
| Firms surveyed | 354 |
| Plan to use offsets | 123 |
| Percentage | 35% |
| Indicate tCO2e offset in latest report | 48 |
| Percentage | 14% |
| Amount of Scope 1 and 2 emissions offset | 6,923,115 |
| Percentage of Scope 1 and 2 emissions offset | 36% |
The current land use for carbon offsetting projects in the UK, and the expected near-term ha of the land covered by carbon crediting projects (calculated using data from company land purchase announcements, which specifically mention carbon offsetting as the purpose of the land purchase).
| Total UK land (ha) | Land used for credits currently (ha) | Current + Company Announcements (ha) | % of land used (near term) | |
|---|---|---|---|---|
| Agricultural | 17,600,000 | 62,214 | 62,214 | 0.4% |
| Peatland | 2,962,624 | 14,052 | 16,797 | 0.6% |
| Woodland | 3,206,000 | 57,174 | 83,841 | 2.6% |
The number of carbon offset retired in the UK and globally, and the percentage of credits retired in the UK vs. rest of the world.
| Total | 2021 | |
|---|---|---|
| Global Retirements (FTSE350) | 19,586,099 | 5,973,164 |
| Credits Anonymously Retired | 60% | 60% |
| Total estimate for FTSE350 | 48,965,248 | 14,932,910 |
| Global Retirements (Non-FTSE350) | 4,248,984 | 1,955,345 |
| UK (FTSE350) | 41,456 | 16,976 |
| UK (Non-FTSE350) | 1,785 | 279 |
| Proportion of UK Credits | 0.08% | 0.10% |
The below charts showcase the breakdown of UK projects by type, as well as the types of projects that UK firms offset with, and the types of credits UK project proponents have retired (skewed towards energy efficiency projects run outside of the UK).
- UK Projects: The data on estimated number of credits generated by project types is heavily skewed by two Verra projects, which anticipate to generate nearly 300,000 tons of carbon per year.
- Projects purchased by UK companies.
- UK Proponents.
A global insight
USA (Climate Trade, 2022)
Regulation
With regard to forestry, carbon regulation is extremely similar to the UK.
Stats/market size
The latest State of the VCM Briefing by non-profit Ecosystem Marketplace reveals that the market has already topped the US$2BN mark in 2022. Growth has been driven by both higher prices and stronger demand for carbon credits, with nearly 500 million credits traded in 2021, at an average price of US$4 per ton – up 60% year on year.
But Ecosystem Marketplace (EM) also attributes this tremendous growth to international efforts to standardize the voluntary carbon market, increasing transparency and quality. In particular, the organisation cites the Public Consultation for Core Carbon Principles (CCPs) by the Integrity Council for the Voluntary Carbon Market (ICVCM), which launched on July 27, 2022 to provide the framework needed to identify high-quality carbon credits that create real, additional and verifiable climate impact with high environmental and social integrity.
Demand
Transaction volumes increased in almost all the carbon credit categories covered in the report, with forest and land use projects showing the strongest growth from 57.8 million credits traded in 2020 to 227.7 million in 2021. Altogether, forestry credit transactions represented about US$1.3B – almost 67% of the market total in 2021.
Renewable energy project demand more than doubled, from 93.8 million to 211.4 million credits. Additionally, the pricing of these credits went from US$1.08 to US$2.26, bringing the value of transactions to a total of US$479.1M.
Among the types of projects that received less demand in 2021, energy efficiency saw the biggest drop, going from 30.9 million credits in 2020 to 10.9 in 2021. Meanwhile, sales of carbon credits from household and community projects decreased from 8.3 million to 8 million. In both cases, an increase in the price of credits softened the impact of this drop on value.
Pricing
See above, the average price of a credit was $4 in 2021.
Projects that presented benefits beyond carbon mitigation, such as community support, biodiversity conservation or contribution to the Sustainable Development Goals (SDGs), were sold at a premium compared to others. For instance, the price of Gold Standard projects, which include co-benefits in the certification process, increased by 35% from US$3.74 a ton to $5.05 a ton.
Opinions
Despite the market already experiencing high activity, the overall opinions seem to be a continued demand for transparency and quality assurance of credits. Climate leading organisations ask for continued government participation to ensure the market remains correctly regulated and drives genuine climate solutions.
New Zealand
As previously mentioned in the forestry section, in New Zealand carbon credits can be generated, calculated and sold on any forestry planted post 1989. Credits can be sold annually, or in intermittent chunks, either back to the government or directly to businesses or individuals.
To calculate the amount a carbon sequestered by a forest they have two methods:
Stock change accounting
The stock change method accounts for short-term changes in carbon storage. Using this method, you earn units as your forest grows and need to pay units when it’s cleared.
Average accounting
Averaging accounting accounts for the long-term carbon storage of your forest land. With averaging accounting, you earn units until your forest reaches a certain age. You can then harvest your forest without having to pay units, as long as you replant (Ministry for Primary Industries, 2022).
Conclusion
With increasing publicity around voluntary carbon markets they are being scrutinised on what is and isn’t accepted as a quality offset – with additionality being at the forefront of this. With too many examples of poor-quality offsets through projects that aren’t properly verified, or failing to sequester any additional carbon, companies are struggling to find a standard that they can trust and be sure that purchasing won’t lead to a PR backlash or a failed offset. Therefore, high quality verification standards like the WCC and PC are likely to rise and be seen as the premium credit verifiers, enabling projects enlisted under them to sell their ‘premium’ carbon credits.
With increasing prices and a growing variety of carbon credits available, corporates must be cautious when entering this market. Varying credits come with their varying risks which can often be detrimental to a carbon investment. For organisations to use the voluntary carbon market successfully, first, they must decide on their net zero strategies. Are they looking to offset annually, biannually, in 3 or 5 year chunks or not at all? This enables them to reduce the risk of their climate investment to ensure safer returns. Should you be looking to enter the voluntary carbon market in any capacity, please do get in touch with us at CCB and we will navigate and guide you through this process.
Glossary
Definitions
- ACR – American Carbon Registry
- BECCS – Bioenergy with carbon capture and storage
- CAR – Climate Action Reserve
- CCC – Climate Change Committee
- CCS – Carbon capture and storage
- CDM – Clean Development Mechanism
- CMA – Competition and Market Authority
- DACCS – Direct air carbon capture storage
- DEFRA – Department for Environment, Food & Rural Affairs
- ECIU – Energy and Climate Intelligence Unit
- ETC – Energy Transitions Commission
- ETS – Emissions trading system
- GHG – Greenhouse Gases
- JI – Joint Implementation
- Kha – Thousand Hectares
- MRV – Measurement, reporting and verification
- MtCO2e – Megaton of CO2 equivalent (1 megaton = 1 million tonnes)
- NDC – Nationally Determined Contribution
- PC – Peatland Code
- PIU – Pending Issuance Unit
- QAS – Quality Assurance Scheme
- tCO2e – Tonne of carbon dioxide equivalent
- UNFCCC – United Nations Framework Convention on Climate Change
- VCM – Voluntary carbon market
- VCMI – Voluntary Carbon Markets Integrity Initiative
- VCS – Verified Carbon Standard
- WCaG – Woodland Carbon Guarantee
- WCC – Woodland Carbon Code
- WCU – Woodland Carbon Units
- W/PCU – Woodland/Pending Carbon Unit
Bibliography
- AlliedOffsets. (2022, July). Supply and Demand in the UK Voluntary Carbon Market.
- Climate Change Committee. (2022, October). Voluntary Carbon Markets and Offsetting.
- Climate Trade. (2022, August 4). Voluntary carbon market value tops US$2B. Retrieved from Climate Trade: https://climatetrade.com/voluntary-carbon-market-value-tops-us2b/.
- Harvey, C., & Moseman, A. (2022, June 16). How many new trees would we need to offset our carbon emissions? Retrieved from Climate Portal: https://climate.mit.edu/ask-mit/how-many-new-trees-would-we-need-offset-our-carbon-emissions.
- Maxwell, T. (2022, March). Abatable Market Insights: The UK Voluntary Carbon Market.
- Ministry for Primary Industries. (2022, 12 21). Earning units through carbon accounting in the ETS. Retrieved from Ministry for Primary Industries: https://www.mpi.govt.nz/forestry/forestry-in-the-emissions-trading-scheme/emissions-returns-and-carbon-units-nzus-for-forestry/accounting-for-carbon-in-the-ets/.
- Scottish Forestry. (2022, May 06). Blog: new additionality rules for the Woodland Carbon Code. Retrieved from Scottish Forestry: https://forestry.gov.scot/news-releases/blog-new-additionality-rules-for-the-woodland-carbon-code.
- Scottish Woodlands. (2022). Woodland Carbon. Retrieved from Scottish Woodlands: https://www.scottishwoodlands.co.uk/services/carbon/#goto-our-services.
- Strutt & Parker. (2022, February). A guide to carbon markets. Retrieved from Simple guide to carbon markets: https://rural.struttandparker.com/wp-content/uploads/2022/03/Simple-Guide-to-Carbon-Markets-Feb-2022_web.pdf.